
The Critical Rendering Path
Intros, 1 & 3
The goal is to run apps at 60 frames per second, and it's more than just JavaScript to think about to get there.
A demo to help us experience judder and jank, later we'll learn to diagnose and solve those issues.
Judder
A discussion on why judder is bad, how it effects users experiences and choices, and how much users care about it (a lot).
60 fps
Reinforcement that the target for smooth scrolling and other animations is 60 fps. Most devices run at 60 fps and people notice when a when a frame is skipped.
This leaves us with 16 milliseconds to render each frame, but as the browser has some overheads to take care of, it's more realistic to aim for 10 to 12 milliseconds per frame.
What goes into a frame
This explains much of the previous course but in summary:
- Parse HTML in the browser means building the DOM
- Recalculate Styles means build the Render Tree
display: none are
not added to the Render Tree. Also, elements added by CSS such as
p:after {content: "some text"} will get added to
the Render Tree.
- Layout is when the browser calculates the sizes and positions of each element in the Render Tree.
- Paint is the process of rasterizing the document to be painted on the screen. This has many sub-steps and which can be viewed in Dev Tools, and is very expensive.
- Image Decode happens inside Paint and is the process of decoding and painting bitmaps to screen.
- Composite Layers is the process of handling multiple layers. This can be more efficient than painting the whole page to screen at once (especially for pages with animations or scrolling objects).
Take Away: Layout Process is complicated and it's always best to assume that the entire DOM is always in scope, even though the number of nodes effected may be different.
Layout and Paint
A typical frame pipeline for anything other than a static page looks like:
JavaScript > Style > Layout > Paint > Composite
The first step (JavaScript, although it could be CSS animation or Web Animation API) is any visual changes to the page. And it usually triggers all of the next steps to be performed. But we want to avoid triggering as a many and as often as possible.
If you use JavaScript to change a Layout property, such as the width of an element, then all the steps will be run.
If you change a Paint-only property, like font color or swapping an image, then the Layout step is skipped.
The 3rd way to make changes just making Composite changes. This can skip both Layout and Paint. Note that skipping Paint can be a huge benefit.
CSS Triggers
A list of all CSS triggering changes can be found here. Use this to ensure CSS changes trigger the least amount of work for the browser as possible.
Summary for Part 1: what we learned
- Why we care about hitting 60fps
- What browser work goes into making a frame
- Different property changes have different levels of impact
Application Life-cycles
Picking and choosing your battles of when to achieve 60 fps (and what other targets to have and when to aim for them).
RAIL
Response - Animation - Idle - Load
(could also be LIAR in a normal first pageload timeline).
- Load: 1 Second. Defer anything non-critical until after the page has loaded.
- Idle: 50 ms. Idle time usually comes in chunks of 50 ms which is the ideal time to add more stuff to the page.
- Animate: 10-12 ms. (60 fps) For scrolling and animations.
- Response: 100 ms. This is the response to any user inputs or actions, like clicks or key presses.
See FLIP for super-fast animation tricks.
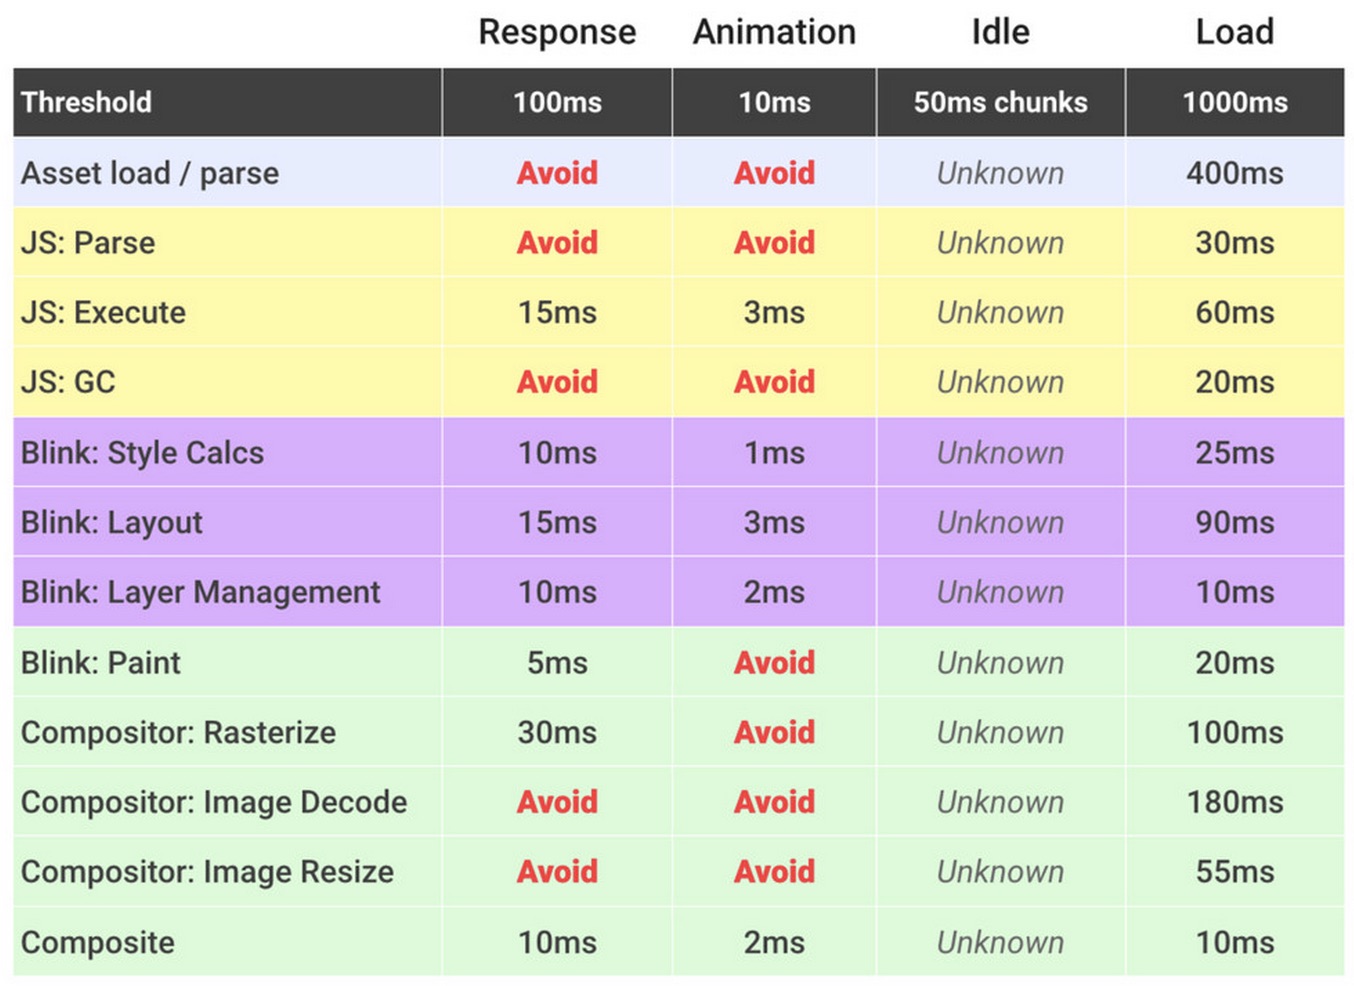
Remember that both Layout and Paint are severely effected by the number of elements that they have to be applied to. There is not an unlimited budget, even when code seems to work within the target timespan. Here's some budgeting guidelines:
The Dejudderification Toolbox
Chrome Dev Tools - Timeline
DevTools
A look at the timeline, with flame view,waterfall view 30/60 fps lines. Make selections in the frames area on top and use W, A, S and D to navigate (also mouse wheel).
The records are color coded; blue for Parse HTML (which is never really a bottleneck). Purple for Recalculate Style and Layout. Green for Paint and Composite, and Orange for JavaScipt execution.
In the flame view you can see which records are children of other records (on the line directly below) and which records lead to others (directly after on the same line).
The Details pane will show you more information about the record you have selected. They're all different depending on the type of record. For example JavaScript records will give you a link back to the line in the code where the JavaScript was called. The details pane can also give more detail about warning and errors.
Test all the Devices!
A timely reminder to test on actual devices because the desktop (and the device emulators on desktop) will far out-perform real devices and give you a false impression of a non-performant app.
Testing Strategies
Make sure you're collecting clean data.
- Quit any other apps
- Open an incognito window
- Focus on cause of bottlenecks, not the symptoms
- Measure first, then optimize
That was basically it, just a deeper dive into DevTools.
JavaScript Performance
A look at the common causes of jank. Find, fix and test with DevTools. Starting with JavaScript.
Just In Time (JIT)
Because JavaScript is compiled just-in-time, there is no point chasing micro-optimizations.
Request Animation Frame
During animated frames we typically, really only have about 10 ms to finish a frame. The JavaScript part can only get 2 to 3 of those milliseconds to its thing.
requestAnimationFrame schedules the JavaScript to run at the earliest opportunity of each frame, it also manages how often it will be called, to make itself as efficient as possible.
Older code uses setTimeout() and setInterval(), but this is not efficient at all. IE9 doesn't understand rAF, so a polyfill is needed for it.
To use requestAnimationFrame you make a call to it and tell it which function you want to call, for example:
requestAnimationFrame(someFunc);Inside the function that it calls, at the end, you need recall it in the same way again, to schedule the next run. The browser takes care of the 'when' and 'how' it should run for you.
	someFunc() {

		// some code;

		requestAnimationFrame(someFunc);
	}
JavaScript Profile
The JavaScript profiler in DevTools will display in-depth information about what function calls are being made within the JavaScript. The profiler should only be turned on on its own as the Timeline recording takes a hit when gathering the extra information.
Web Workers
Web workers provide a means to use a different processor thread to run separated JavaScript code asynchronously from the main thread. This will help prioritize interface updates to make an app or page feel responsive and snappy.
Worker files are downloaded asynchronously and when they fail,
they fail silently. A new worker is created with the Worker
constructor function var worker = new Worker('wrkrfile.js')
.
Web workers can post and receive messages with the main JavaScript thread via an event listener. You can't use the 'window' shortcut in a Worker to get the global context, because they don't run in the window. You must use 'this' instead. For the same reason, you can't do DOM manipulations in a Web Worker.
Data is sent back and forth via the postMessage()
method, and is received via the onmessage event
handler. The message is contained within the Message event's
.data attribute. (Note that the data is copied rather
than shared. The postMessage() method can accept
either a string or a JSON object.
Note that onmessage and postMessage()
need to be hung off the Worker object when used in the main script
thread, but not when used in the worker. This is because inside the
worker, the worker is effectively the global scope.
You can also terminate workers, set them to terminate themselves handles errors, spawn sub-workers and import other scripts and libraries. You can also spawn SharedWorkers which are a little more complex and require a port to opened.
You can also create 'inline' workers like this:
	var blob = new Blob([
		"onmessage = function(e) { postMessage('msg from worker'); }"]);

		// Obtain a blob URL reference to our worker 'file'.
		var blobURL = window.URL.createObjectURL(blob);

		var worker = new Worker(blobURL);
		worker.onmessage = function(e) {
			// e.data == 'msg from worker'
	};
	worker.postMessage(); // Start the worker
Memory Management
JavaScript automatically collects garbage while it works. This is not in your control, and it's not really possible to predict when and where it will happen. To get an indication of what is happening, turn on the memory profiler in the Timeline tools.
Styles & Layout
Note that the number of elements to be styled will effect performance on a linear basis. That is, 1000 (same) elements will take 10 times longer to calculate than 100.
Secondly note that, Selector Matching specificity has a vey big impact on performance too. Using Block-Element-Modifier (BEM) naming guidelines is quite good for performance.
But remember, the only way to really tell what matching pattern is fastest, is by measuring!
Layout Thrashing
Layout thrashing is probably the most common issue when styles
cause bad performance. This will happen when you query an element's
position, like with element.offSetWidth and then use
it it to perform a new layout, all inside a loop. Unintuitively,
using .offSetWidth causes a layout re-calculation on
it's own, even if you don't change anything. To avoid this, hoist
such queries of styles out of loops, as the result will probably
be an invariant.
This is also called a "Forced Synchronous Layout" by Dev Tools and it will be highlighted in the Timeline records for you.
Remember to check out CSS Triggers for a list of which CSS properties trigger which browser actions.
The main principle to avoid Forced Synchronous Layout is to batch queries and style update together, don't alternate them. Also, there's a script out there for batching... in my other notes....
For a concise list of CSS properties that trigger layout see this post by Mr. Gentilcore.
Summary
Remember, although we are trying very hard to prevent triggering Layout, the main reason not to trigger it, is that is always triggers Paint - which is super-expensive when trying to animate at 60 fps.
Remember the RAIL budgets: Response 100 ms, Animate 10-12 ms, Idle 50 ms, and Load 1000 ms.
Painting and Compositing
Not all styles are equal, some trigger Layout, Paint and Composite, some trigger just Paint and Composite, and a couple only trigger Composite.
Paint Optimization
The Tools: In Dev Tools, you open the console (Esc key), and switch to the Paint tab. This tab's pane has a few check-boxes, one of which is "Show Paint Rectangles". This paints a semi-opaque green rectangle over repaints. During a page scroll, the only thing that should be getting repainted is the scroll bar. If the whole page is being repainted, then there is a problem to hunt down.
By turning on Paint in the Timeline profiler you can get an in- depth review of all the paint commands that are run during a Paint event. This a sub-timeline in the Paint Profiler tab's pane.
Compositing
Compositing is the act of layering the content to allow overlays of different layers to get repainted without effecting the whole page. This the same concept as Image and Video editing software.
In Dev Tools the 2 records associated with Compositing are "Update Layer Tree" and "Composite Layers". Update is where Chrome calculate how many layers it needs, and Composite is the act of putting them on screen. The more layers you have, the more time will be spent in layer management.
Layer management is mostly automatically controlled by the browser, but we can force it to generate layers and even better, when it is supported by browsers, we can give it hints about what might be good places to create layers. Always check to see if and element already has its own layer before creating one for it!
In the console you can check the box "Show Composited Layer borders" to see what's going on. Blue lines represent the tiles that each layer is split into, and orange lines represent elements on their own compositor layers.
To hint to the browser to give an element its own layer:
element {will-change: transform;}.
To force an element onto its own layer (hacky) element
{transform: translateZ(0);}. Don't put everything on its
own layer, think carefully where to apply, and test for improvement
before using. Note this still relies on the hacky method to work
in all browsers, so it should not be relied on at all.
More Cool Tools: when you create a Paint profile in the Timeline you can also view the number of layers created, and the reason each was created. You can also view a 3D representation of the layer structure, which is very helpful.
When you force a layer to be created, you need to be careful because it can trigger other elements to become layers too.
And that's about it for that course, for now.